September 10th, 2025
13 Top Financial Analysis Software Tools in 2025: Tested & Rated
By Simon Avila · 45 min read
Financial analysis software helps companies make sense of their numbers. I use a few top options daily to handle forecasting, reporting, and budgeting. Businesses do the same, so their finance teams can focus on decisions instead of spreadsheets.
Expert take:
We built Julius to be a pocket data scientist for finance teams. I’ve found it helpful for quick cash flow checks and database pulls when I don’t want to wait on reports.
For teams that prefer spreadsheets, Cube adds automation on top of Excel and Google Sheets without changing familiar workflows. When a company gets bigger and needs to manage multi-entity reporting, NetSuite has the depth to handle that complexity.
For teams that prefer spreadsheets, Cube adds automation on top of Excel and Google Sheets without changing familiar workflows. When a company gets bigger and needs to manage multi-entity reporting, NetSuite has the depth to handle that complexity.
13 Best financial analysis software: TL;DR
If you don’t want to read the full breakdowns, this table shows what each platform is best for, the starting price, and its main strength. Take a look below:

1. Julius: Best for fast AI-powered financial analysis
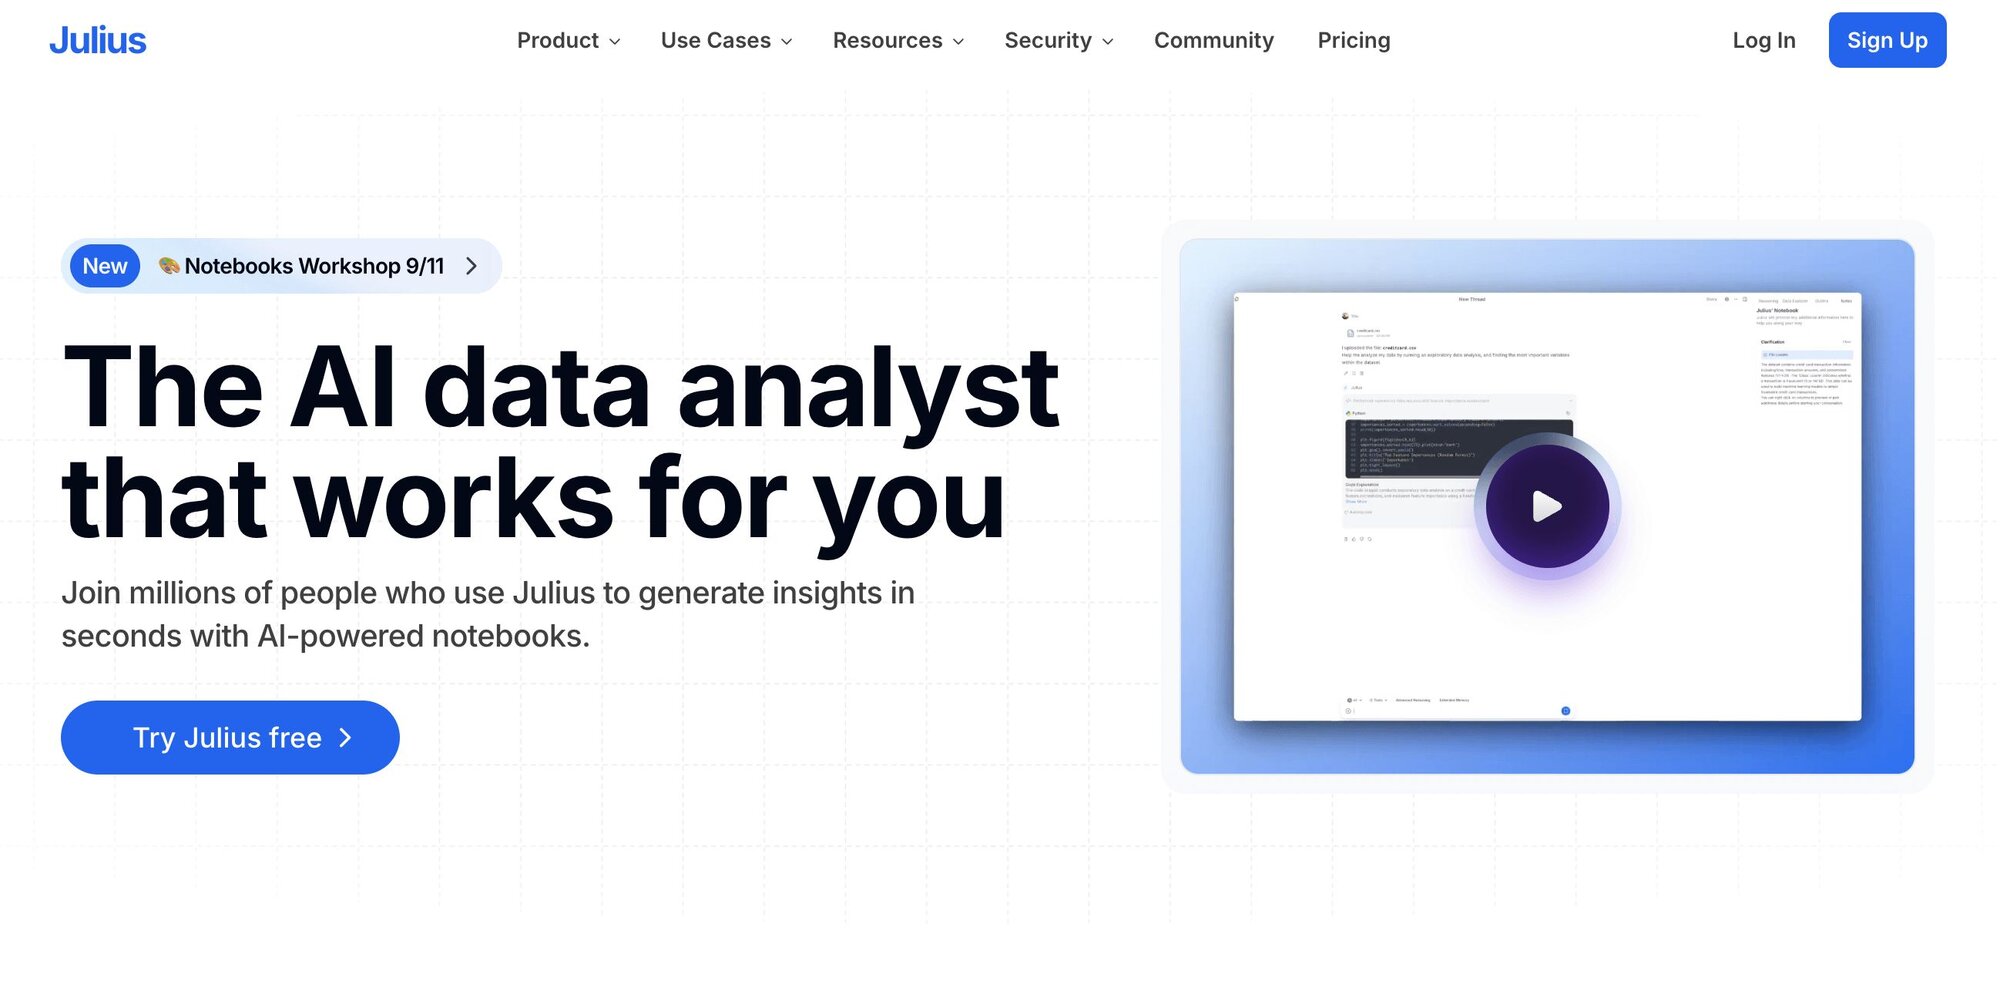
What it does: Julius is an AI data analysis platform that works like a pocket data scientist. You can upload spreadsheets or connect databases such as Postgres, Snowflake, or BigQuery, then ask financial questions in plain English to get instant insights, charts, and reports.
Who it’s for: Finance professionals who want fast analysis without relying on analysts or setting up heavy FP&A software.
We use Julius to move faster on repetitive financial analysis jobs. With it, you can ask a plain-language question and get an answer right away. Sometimes it’s a quick cash flow check, other times it’s looking at net revenue retention (NRR) across customer cohorts. That flexibility sets Julius apart from FP&A systems that require more setup and structure.
One feature we put a lot of work into is the database connectors. If your team uses Postgres or Snowflake, you can pull data straight into Julius without writing SQL. That way, analysts spend less time on manual queries and managers can get the numbers they need without waiting.
You can also rely on scheduled reports to keep weekly updates consistent, and Notebooks when you need to package analysis for board meetings.
That said, we admit Julius has limits. It won’t replace Workday or NetSuite when you need structured forecasting or multi-entity consolidations. Where it shines is in the speed of daily checks and the clarity it brings to meetings.
Key features
Natural language queries: Run financial analysis without SQL or Python
Data connectors: Link to Postgres, Snowflake, BigQuery, Stripe, and more
Data visualization engine: Create charts and reports on the fly
Automation: Schedule reports via Slack or email
Error handling: Iterates and retries analyses instead of failing once
Buy if
You want AI to speed up financial analyses
You need to query large datasets without coding
You value quick answers for board meetings or investor updates
Don’t buy if
You need a full FP&A suite with budgeting workflows
You want complex multi-entity consolidations in one platform
Pricing
You can try Julius on the Free forever plan with 15 messages per month. Plans start at $20 per month for 250 messages to Julius.
Bottom line
Pick Julius if you want self-serve analysis for finance that anyone can run in plain English. It’s strong at cohort KPIs (like NRR) and quick “what happened vs. why” variance checks. We lean on it to prep board-ready charts in minutes. However, if full budgeting workflows and structured forecasting are your priority, Workday Adaptive Planning may be a better fit.
2. Cube: Best for spreadsheet-native FP&A
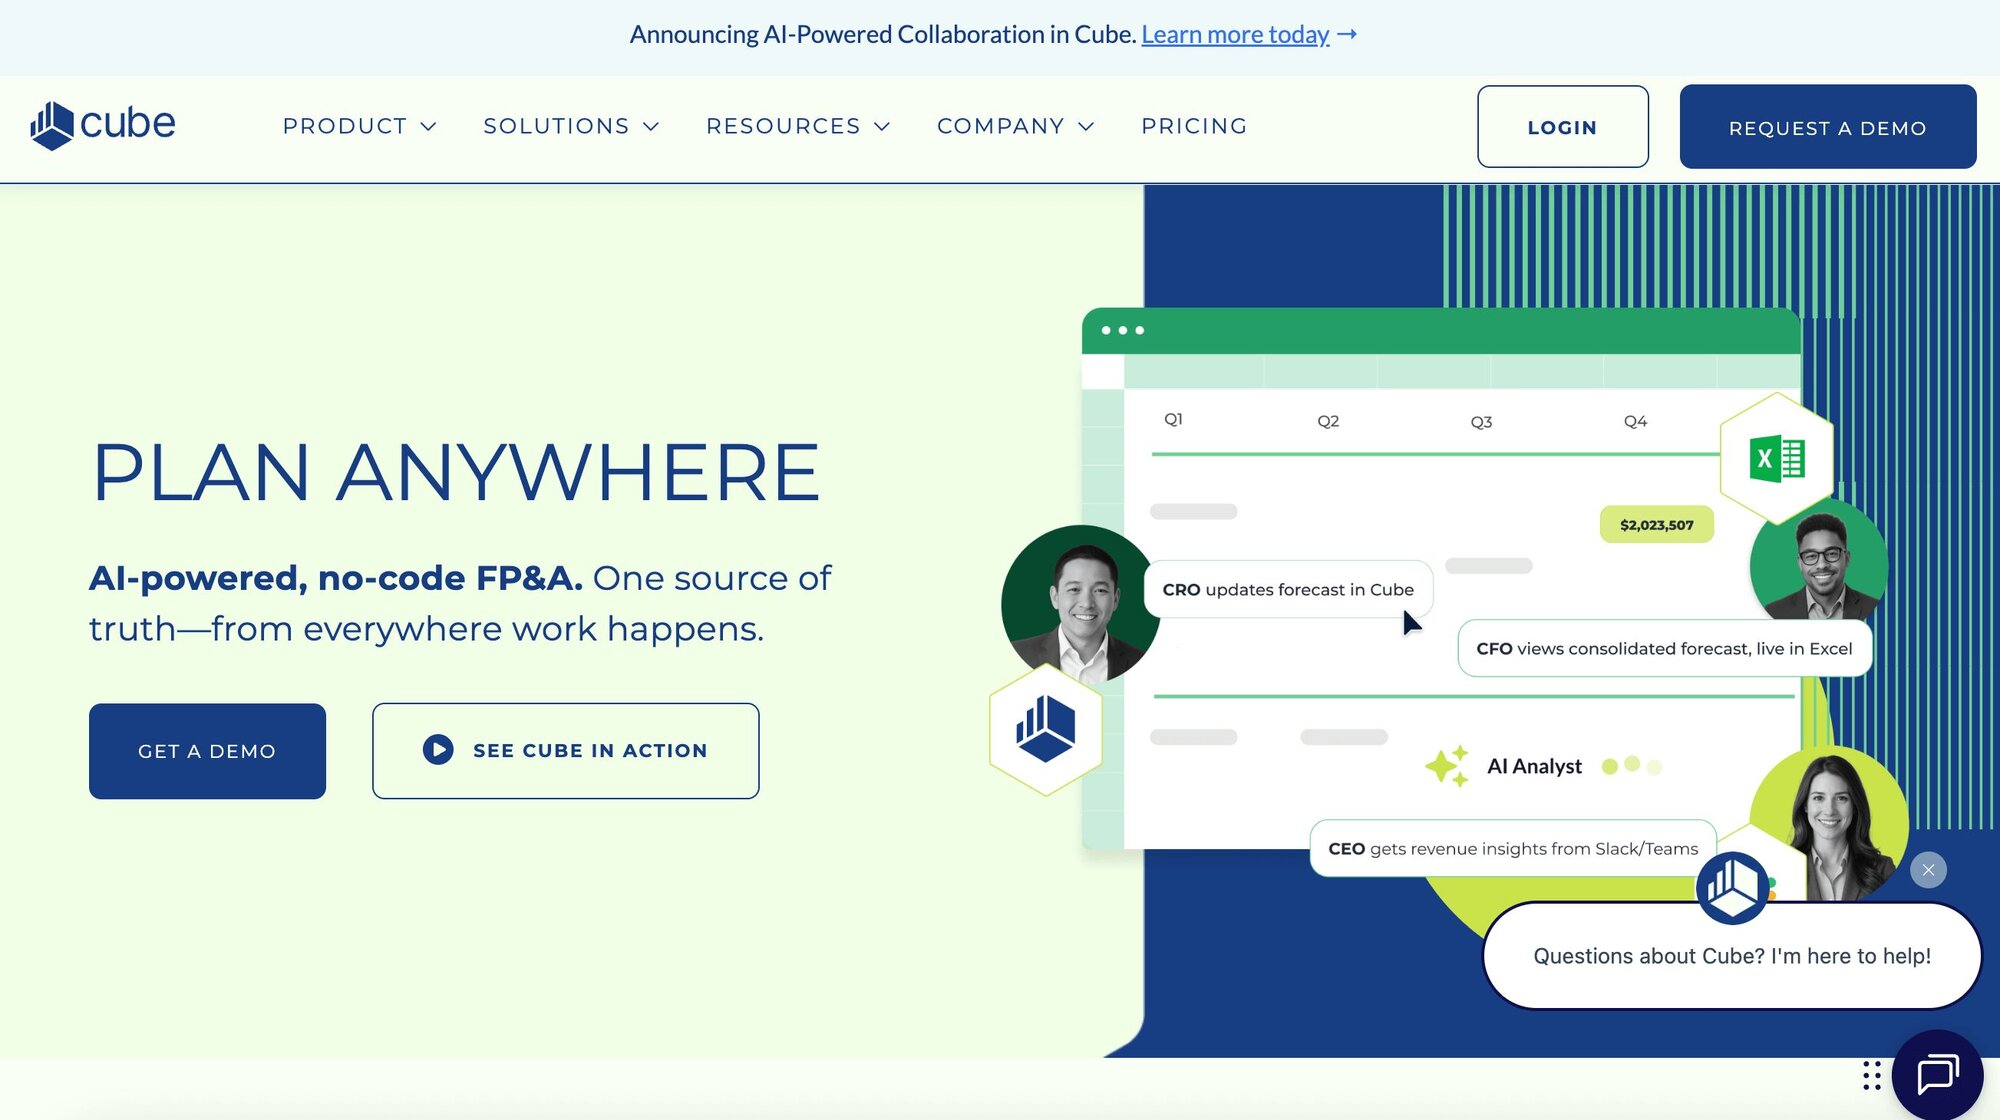
What it does: Cube is an FP&A platform that connects directly to Excel and Google Sheets. It adds automation and control to budgeting, forecasting, and reporting while letting teams keep their spreadsheet workflows.
Who it’s for: Finance teams that want to stay in spreadsheets but need more accuracy and speed.
I started with Cube because I wanted to see how far a spreadsheet-native FP&A tool could really go. The setup linked directly to Excel and Google Sheets, so I didn’t have to move away from a familiar environment. That connection made it easy to bring in live data, run forecasts, and share updates without copying numbers from one sheet to another.
The feature I leaned on most was automated rollups. Cube consolidated data across departments and entities in minutes, something that usually takes hours in manual spreadsheets.
It kept formulas consistent and reduced the errors that often sneak in when multiple versions of a file circulate. Scenario planning was also more manageable, since I could test different assumptions without rebuilding models each time.
Cube does have its tradeoffs. It focuses on making spreadsheets smarter, not on giving you flashy dashboards or deep visualization. Teams that want polished reports for executives might need to pair it with another tool like Power BI. But if your team lives in Excel or Google Sheets and wants more accuracy and less manual work, Cube makes that transition smooth.
Key features
Integrations: Connects directly to Excel and Google Sheets
Consolidation: Automates rollups across departments or entities
Forecasting: Offers scenario modeling and predictive planning
Collaboration: Role-based permissions for secure access
Audit trail: Tracks changes for compliance and accountability
Buy if
You rely heavily on spreadsheets for financial planning
You want automation without changing your workflow
You need cleaner consolidations across entities
Don’t buy if
You want advanced dashboards or visualization features
You need a full ERP with accounting included
Pricing
Cube does not list its pricing publicly. Request a quote to learn more.
Bottom line
Cube worked well when I wanted to keep the familiarity of spreadsheets but still cut down on manual work. If you’re looking for deeper dashboards and analytics, Microsoft Power BI might be a better fit.
3. Oracle Essbase: Best for advanced financial modeling
What it does: Oracle Essbase is a multidimensional database tool built for financial modeling and reporting. It lets finance teams create online analytical processing (OLAP) cubes to analyze data across multiple scenarios, entities, and time periods.
Who it’s for: Enterprises that need complex forecasting, scenario modeling, and detailed financial reports at scale.
When I tested Oracle Essbase, I started by building a forecasting model with a few “what-if” scenarios. I loaded in sales and expense data from two regions and created separate versions for baseline, high growth, and cost-cutting cases. Switching between them made it clear how quickly Essbase could show the impact of small changes, like a 3% shift in sales volume or a 5% reduction in operating costs.
Next, I worked with hierarchy modeling. I built a structure that rolled up product lines into categories and then into a company-wide total. The model handled complex relationships without forcing me to simplify the data, which meant I could drill into results by product, region, or time period and still keep the bigger picture intact.
I also explored the integration with Excel using Smart View. That add-in lets me query Essbase cubes directly from a workbook and refresh the numbers without re-uploading files. It kept the workflow familiar but added more depth than regular spreadsheets.
For automation, I tested a few scripts to consolidate data and apply calculations. Once set up, the system processed adjustments across entities in one run, which saved time compared to updating each model separately.
Key features
Multidimensional modeling: Build OLAP cubes for financial analysis
Scenario planning: Compare different forecasts at once
Integration: Works with Oracle’s ERP and planning products
Data scalability: Handles very large datasets and multiple entities
Reporting: Strong in-depth financial reporting options
Buy if
You need advanced scenario modeling and complex consolidations
You want an enterprise-grade tool that scales across entities
You already use Oracle ERP or other Oracle financial tools
Don’t buy if
You want a simple, modern interface
You need a fast setup without IT support
Pricing
Oracle offers custom pricing for Essbase. Contact their sales team to learn more.
Bottom line
Essbase is powerful for enterprises that need deep modeling, but if usability and quick setup matter more, Fathom or Cube may be easier to adopt.
4. QuickBooks: Best for small business accounting and reporting
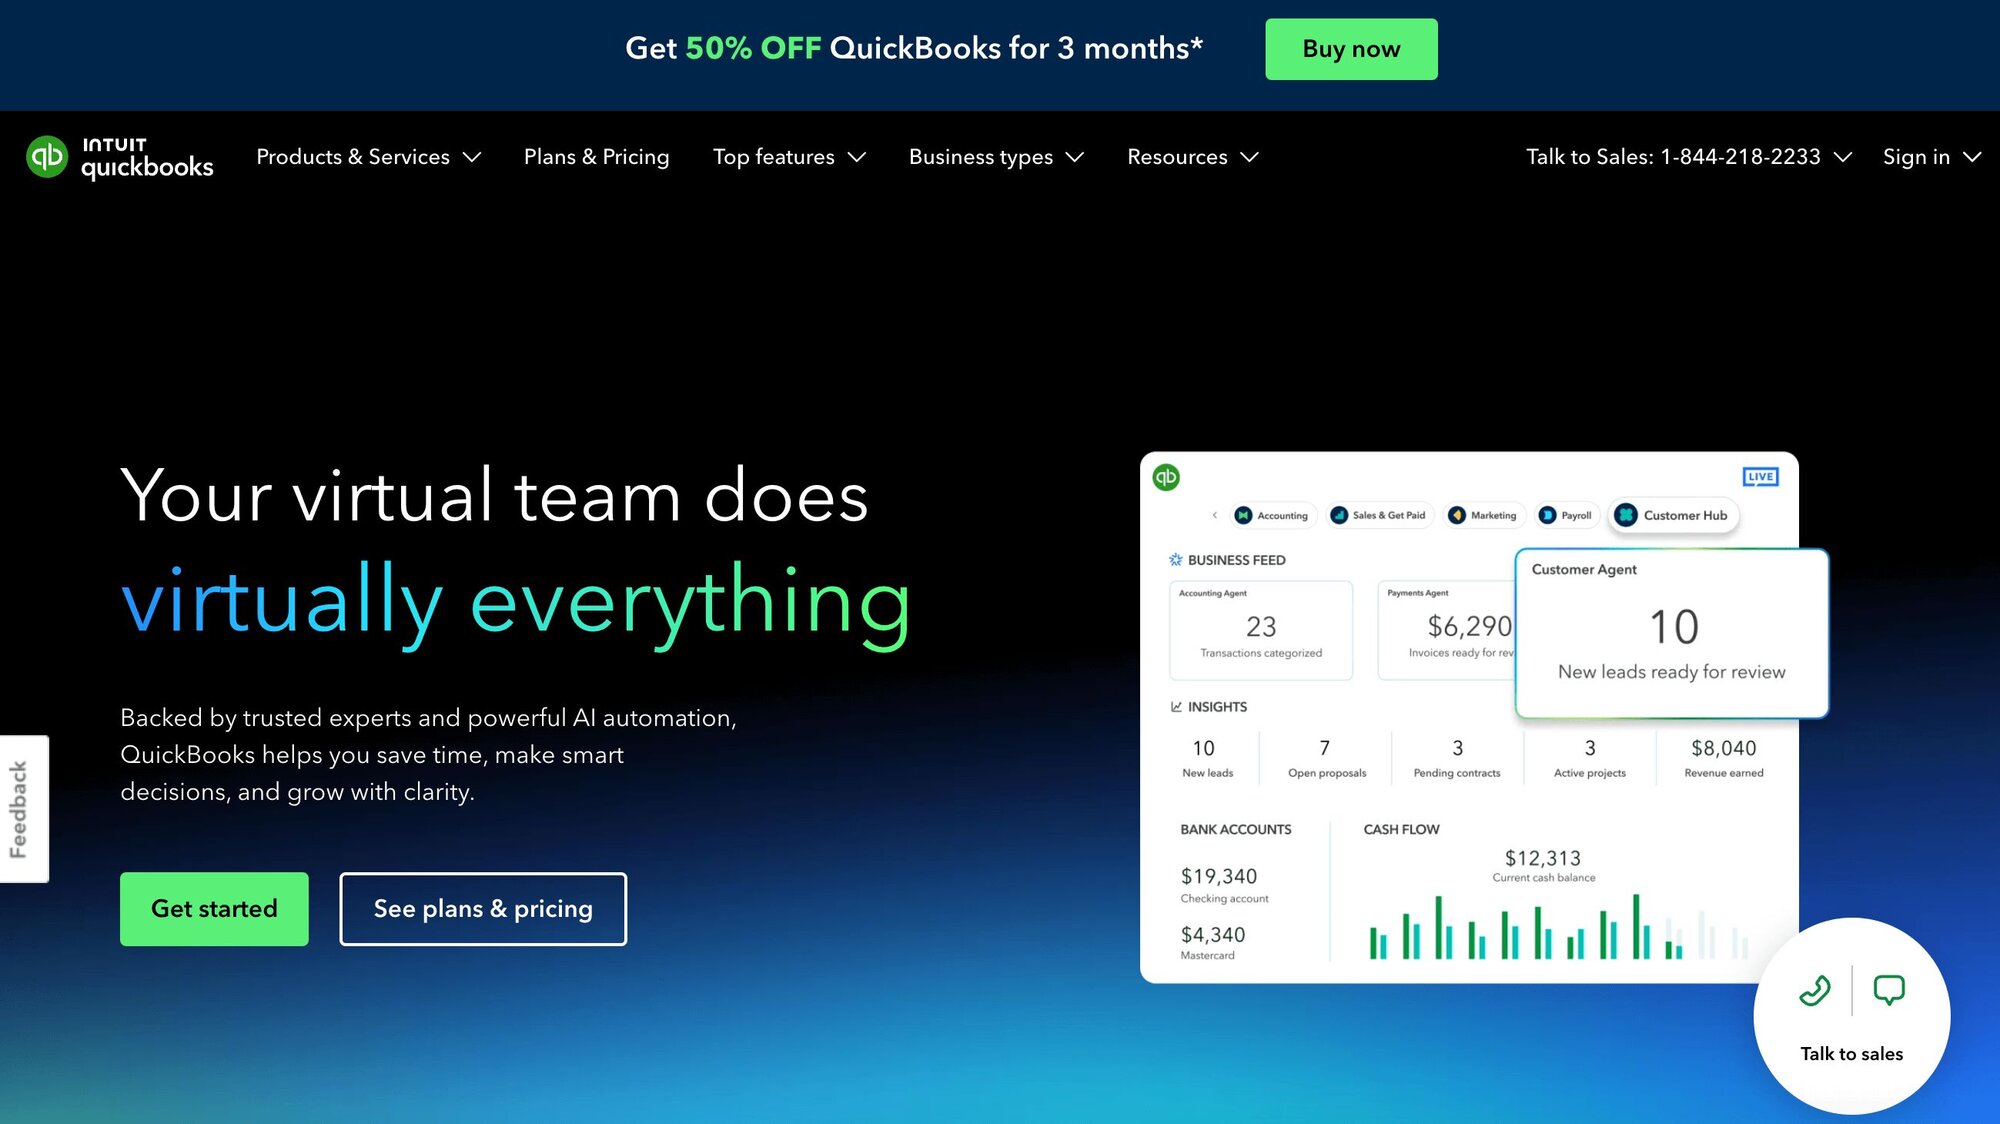
What it does: QuickBooks is an accounting platform that helps small businesses handle bookkeeping, invoicing, payroll, and financial reporting. It also offers built-in dashboards for cash flow, expenses, and tax prep.
Who it’s for: Small business owners or finance teams that need an affordable, all-in-one accounting and reporting tool.
When I tested QuickBooks, the first thing that stood out was how approachable it felt compared to enterprise tools like NetSuite or Workday Adaptive Planning. QuickBooks pulled a lot of the everyday jobs into one system, which made it easier to keep everything organized.
The interface made it simple to set up bookkeeping, connect bank accounts, and start tracking income and expenses without a long learning curve. Within a short time, I was able to generate P&L statements and cash flow reports that looked polished enough to share.
Invoicing was one feature I kept coming back to. Creating and sending invoices directly through the platform, then matching them to payments, saved me from juggling multiple tools. Payroll was another strong point, especially for smaller businesses that don’t want to manage taxes separately.
The limits became clear when I pushed into more advanced analysis. Forecasting and scenario planning weren’t as flexible as what I saw in tools like Sage Intacct or Workday Adaptive Planning. Multi-entity reporting also felt out of reach.
That said, for a small business owner who needs accounting, light reporting, and compliance support in one package, QuickBooks delivers.
Key features
Bookkeeping: Automates income and expense tracking
Invoicing: Creates and sends invoices with payment tracking
Payroll: Manages employee pay and tax filings
Reporting: Generates financial statements like P&L and balance sheets
Integrations: Connects with banks, credit cards, and business apps
Buy if
You’re a small business that needs simple accounting and reporting
You want an affordable entry point into financial analysis
You need integrated payroll and invoicing in one system
Don’t buy if
You need complex forecasting or scenario planning
You want robust multi-entity consolidation
Pricing
QuickBooks starts at $38 per month for 1 user.
Bottom line
QuickBooks is a solid fit for small businesses that want basic accounting with light reporting. Larger teams with complex needs might outgrow it quickly and may need to look at Sage Intacct or NetSuite.
5. NetSuite: Best for enterprise resource planning (ERP)
What it does: NetSuite is a cloud-based ERP platform with strong financial management. It covers accounting, consolidation, reporting, and automation in one system.
Who it’s for: Mid-sized to large enterprises that need full ERP capabilities alongside financial analysis.
NetSuite gave me the most complete look at how an ERP platform handles finance. I tested it with multi-entity data and saw how it consolidated results across subsidiaries and currencies. The system let me set rules for eliminations, so intercompany transactions didn’t distort the reports. Once the mappings were in place, the process ran smoothly and produced one clean set of financials.
I also explored its automation. Approvals for expenses and invoices moved through workflows without needing manual checks, which made it easier to keep transactions on track.
The compliance features stood out too. Every adjustment left an audit trail, and I could trace activity back to the user who made it. That level of visibility is useful when multiple teams work across different regions.
The dashboards pulled finance and operational data into one view. I created a budget vs. actuals report and added metrics from CRM data, which gave me a broader look at performance.
The forecasting tools let me build different scenarios, then update them automatically as new data came in. Running those tests side by side showed how shifts in revenue or expenses would play out across the whole system.
Key features
ERP integration: Combines accounting, CRM, and operations in one platform
Consolidation: Handles multi-entity and multi-currency reporting
Automation: Streamlines approvals, invoicing, and compliance jobs
Forecasting: Built-in scenario planning and budgets
Dashboards: Customizable real-time financial views
Buy if
You need ERP and finance in a single platform
You manage multi-entity reporting with compliance requirements
You want advanced automation across departments
Don’t buy if
You’re a small business that only needs basic accounting
You prefer a lightweight setup and quick adoption
Pricing
NetSuite offers custom pricing. Contact them to learn more.
Bottom line
I found NetSuite reliable for enterprise-level consolidations and automation, but the learning curve was steep. For simpler reporting needs, I’d look at Spotlight Reporting or Sage Intacct instead.
6. Sage Intacct: Best for SMB financial management
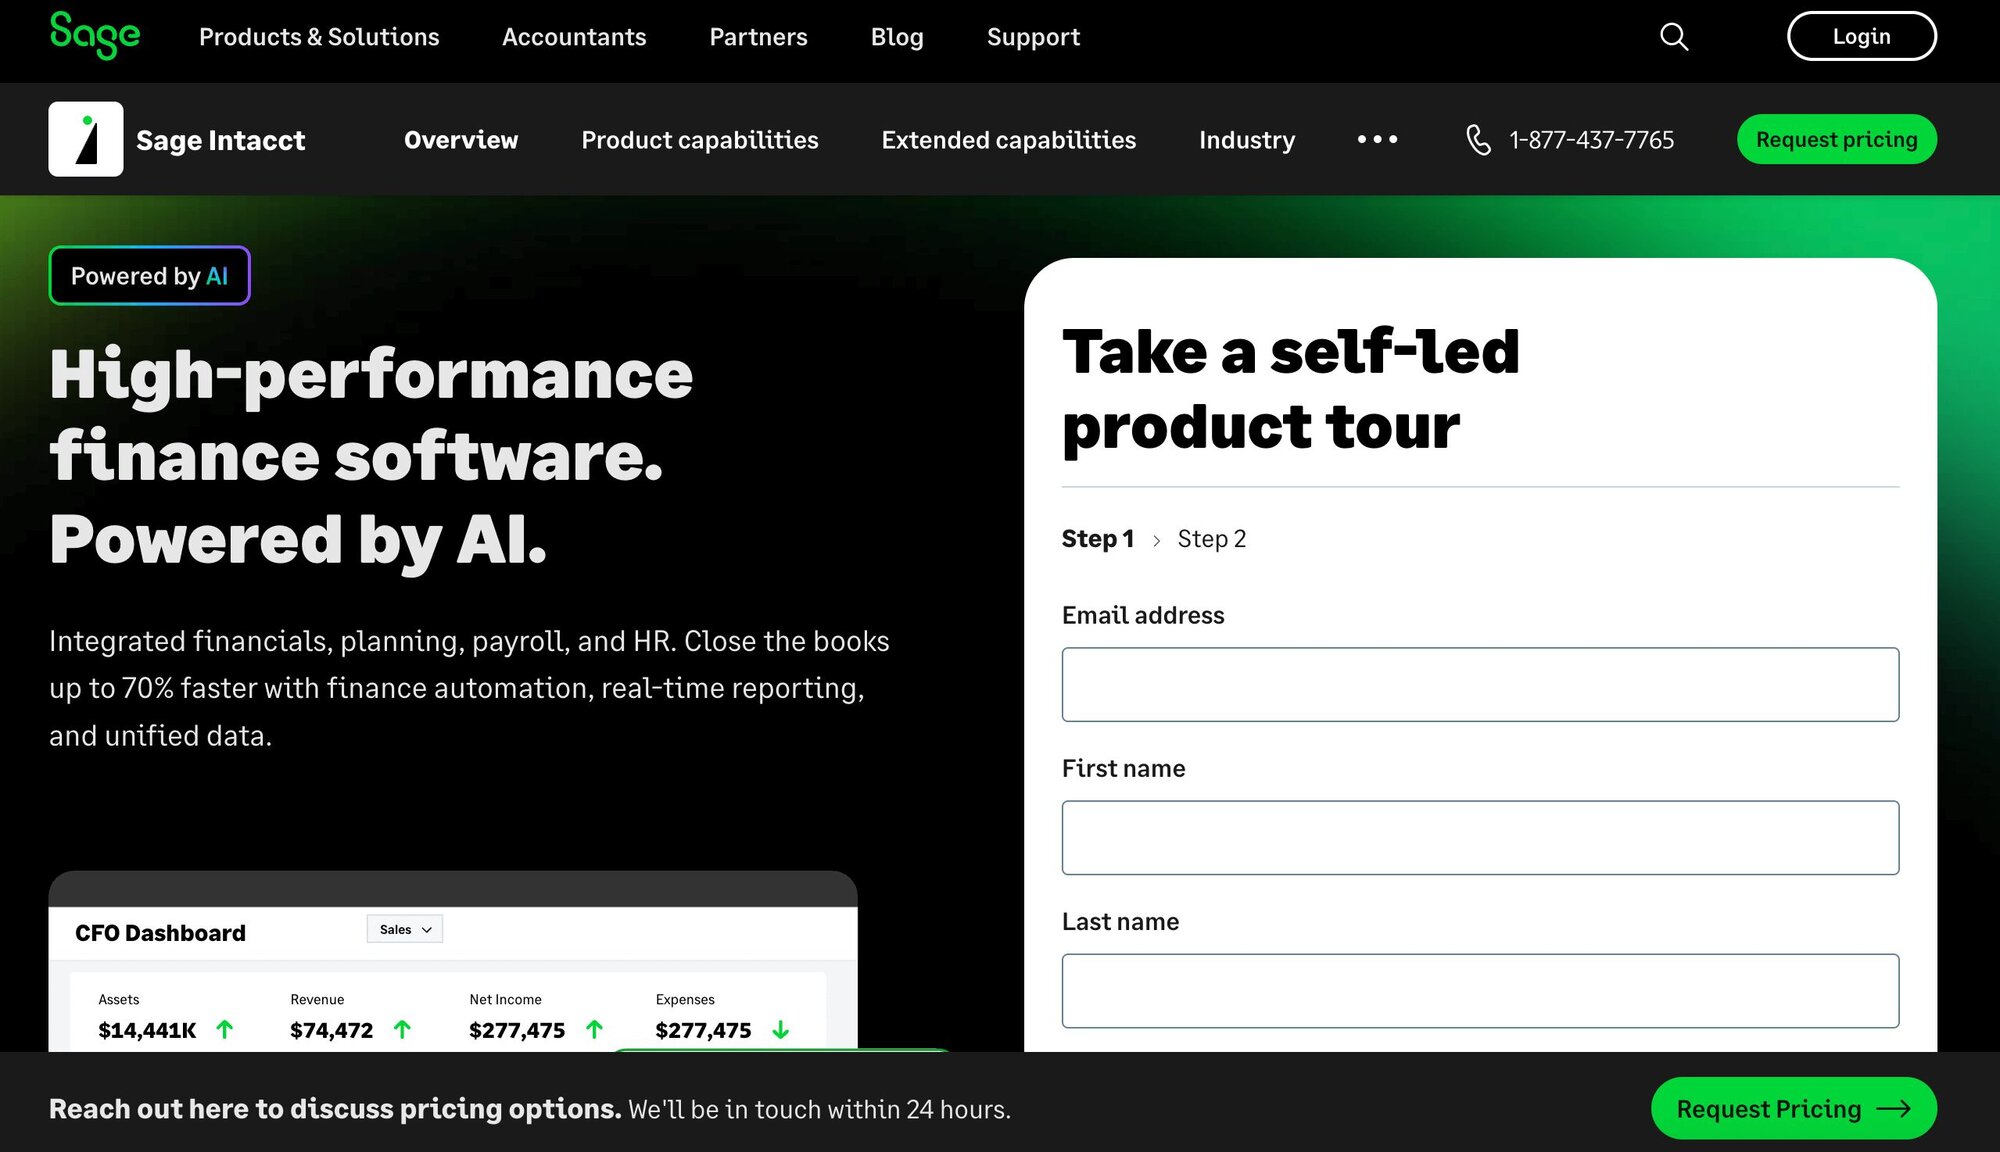
What it does: Sage Intacct is a cloud-based accounting and financial management system. It supports cash flow tracking, AR/AP automation, and customizable dashboards.
Who it’s for: Small to mid-sized businesses that want more advanced reporting than QuickBooks without moving up to a full ERP.
When I set up Sage Intacct, I loaded in sample financials from two entities to see how the system managed consolidations. The cash flow dashboard showed inflows and outflows side by side, and I could drill into each entity to trace where money was moving. That saved me from running separate reports and then stitching them together manually.
I spent time in the Controller Dashboard next. I used it to track accounts payable, customer aging, and gross profit trends. Having those metrics in one place made it easier to spot overdue receivables and compare them against expenses in the same view. I also liked that I could customize the layout so the KPIs that mattered most stayed front and center.
For budgeting, I tested a scenario where headcount increased by 5% and sales climbed by 10%. Intacct updated the forecast automatically, which showed me how the changes would affect margins and operating cash. That scenario-building felt more structured than doing the same in spreadsheets.
I also tried Sage Copilot, the AI assistant. It flagged an anomaly in one of the AP batches and answered a query I typed about our close process. That made it easier to stay on top of issues before they piled up.
Key features
Dashboards: Customizable reports for cash flow and KPIs
AR/AP automation: Streamlines receivables and payables
Multi-entity support: Handles consolidations across subsidiaries
Compliance: Strong audit trails and controls
Integrations: Connects with Salesforce, payroll, and banking tools
Buy if
You’ve outgrown QuickBooks or Xero
You want customizable dashboards for decision-making
You need audit-ready financial records
Don’t buy if
You’re a small business that only needs simple bookkeeping
You want something with a minimal learning curve
Pricing
Sage Intacct offers custom pricing. Contact them to learn more.
Bottom line
Sage Intacct gave me the visibility I wanted into cash flow and reporting, but it still requires some setup. If you need ERP-level depth, NetSuite is the next step up.
7. Microsoft Power BI: Best for data visualization and BI
What it does: Power BI is a business intelligence tool that connects to multiple data sources and turns them into interactive dashboards and visual reports.
Who it’s for: Teams that want strong data visualization with flexible integrations across finance and operations.
When I tested Power BI, the first thing I did was connect it to Excel files and a sample SQL database. The setup let me clean and transform data in Power Query before building reports. I standardized account codes and filtered dates without leaving the interface, which made it easier to get the dataset into shape.
I built a revenue dashboard by region using bar charts, slicers, and drill-downs. One click took me from company-wide totals into specific product lines, which made trends clearer. I also created an expense dashboard by department and tested variance against budget numbers I had stored in Excel. Once published, both dashboards refreshed automatically as new data flowed in.
Collaboration was another key feature. I shared dashboards with colleagues, who could filter views on their own and download reports directly. Embedding one of the dashboards in Teams worked well for keeping non-finance managers in the loop without sending files back and forth.
I also tried Copilot inside Power BI. I asked it to generate a DAX calculation for customer churn, and it wrote the formula in seconds. That saved me from manually troubleshooting syntax and gave me a starting point I could adjust.
Key features
Data integrations: Connects to Excel, SQL databases, cloud apps, and more
Custom dashboards: Build interactive visual reports
Collaboration: Share dashboards across teams or embed them in apps
AI insights: Uses machine learning for trend detection
Scalability: Handles both small datasets and enterprise-level volumes
Buy if
You want flexible dashboards across finance and operations
You already use Microsoft 365 or Azure tools
You need interactive visual reports that go beyond spreadsheets
Don’t buy if
You want a simple out-of-the-box finance tool
You don’t have time for a steeper learning curve
Pricing
Power BI has a free plan. Paid plans start at $14 per month, paid annually. It’s also included in Microsoft 365 E5 and Office 365 E5 if you are already subscribed to those services.
Bottom line
Power BI gave me the flexibility to combine finance data with broader business metrics, though it took more effort to customize. If you prefer something ready-made for finance, Spotlight Reporting may be a better fit.
8. Workday Adaptive Planning: Best for enterprise planning and forecasting
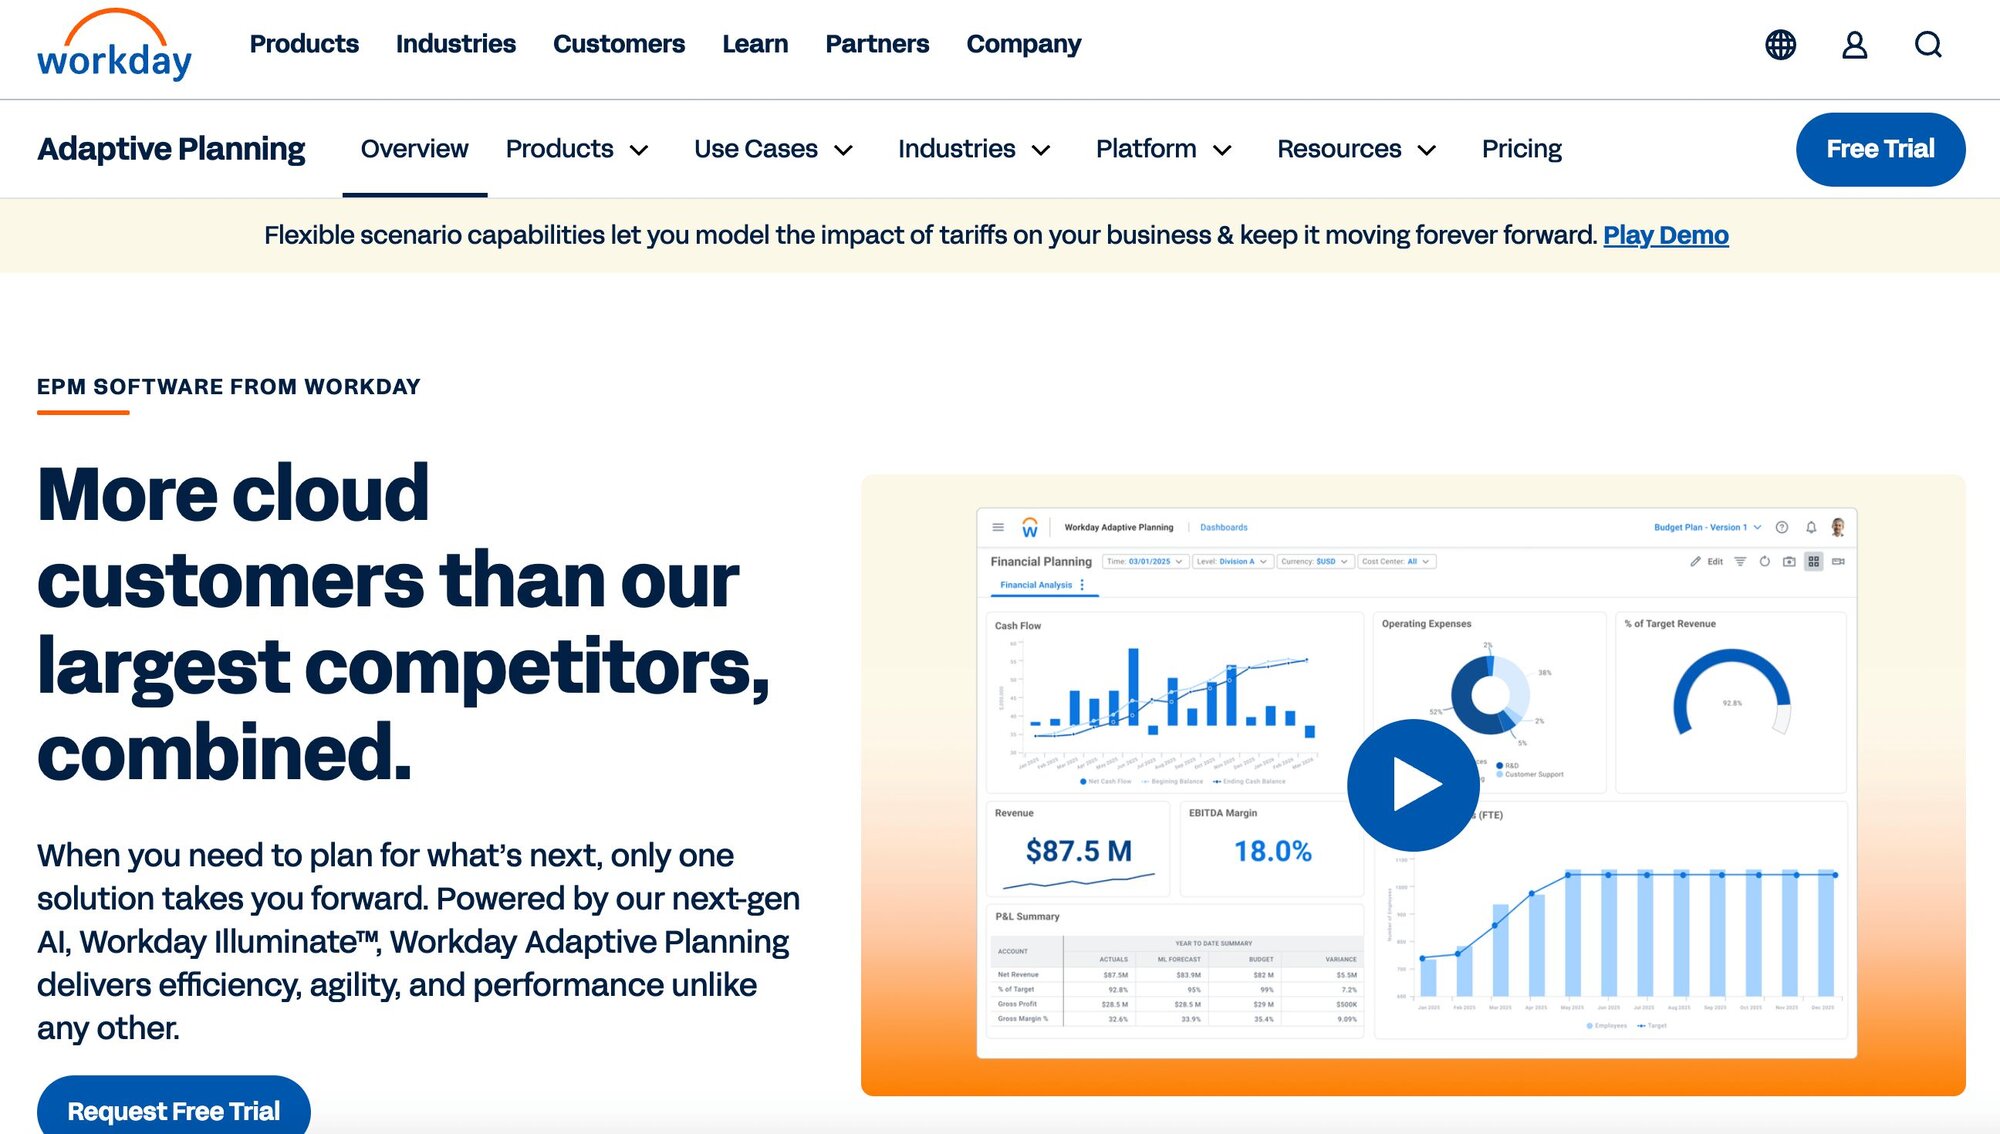
What it does: Workday Adaptive Planning is a cloud-based platform for budgeting, forecasting, and scenario modeling. It focuses on enterprise teams that need structured planning across departments.
Who it’s for: Large companies that run detailed forecasts and need multi-department collaboration.
One of the first things I built in Adaptive Planning was a budget model for a test company with 200 employees. I set assumptions like 5% quarterly revenue growth, a 3% increase in headcount, and a fixed rent expense.
The platform updated the forecast automatically when I changed those numbers, so I could see how an extra sales hire or a dip in revenue would affect margins and cash flow. I created both a baseline and a downside version, which made the differences clear side by side.
I tested collaboration features next. I assigned the marketing budget to one manager and the operations budget to another. Their updates flowed directly into the consolidated plan, and the system tracked each change with names and timestamps. That meant I didn’t need to merge Excel files to keep the budget current.
For reporting, I built a dashboard that compared plan vs. actuals for revenue by product line. I added another one that tracked expenses by department. Each dashboard refreshed daily as new data came in, so I didn’t have to prepare variance reports at the end of the month.
I also linked the system with a sample NetSuite instance. Once connected, journal entries flowed in automatically, which cut out the monthly CSV uploads I’d normally rely on. That made rolling forecasts much easier to update.
Key features
Scenario planning: Model multiple business cases at once
Collaboration: Supports planning across finance, HR, and operations
Forecasting: Automates updates with real-time data inputs
Dashboards: Provides visual views of budgets and forecasts
Integrations: Works with ERP, HR, and CRM systems
Buy if
You need structured, repeatable forecasting
You want to collaborate across multiple departments
You run enterprise-level budgets and scenarios
Don’t buy if
You’re a smaller team with simpler needs
You want a fast setup without a long learning curve
Pricing
Workday Adaptive Planning offers custom pricing. Request a quote to learn more.
Bottom line
Workday Adaptive Planning gave me the structure I needed for enterprise forecasting, but it felt slower to implement. For smaller teams that need reporting without the bulk, Sage Intacct or Fathom may be a better choice.
9. Spotlight Reporting: Best for reporting and consolidation
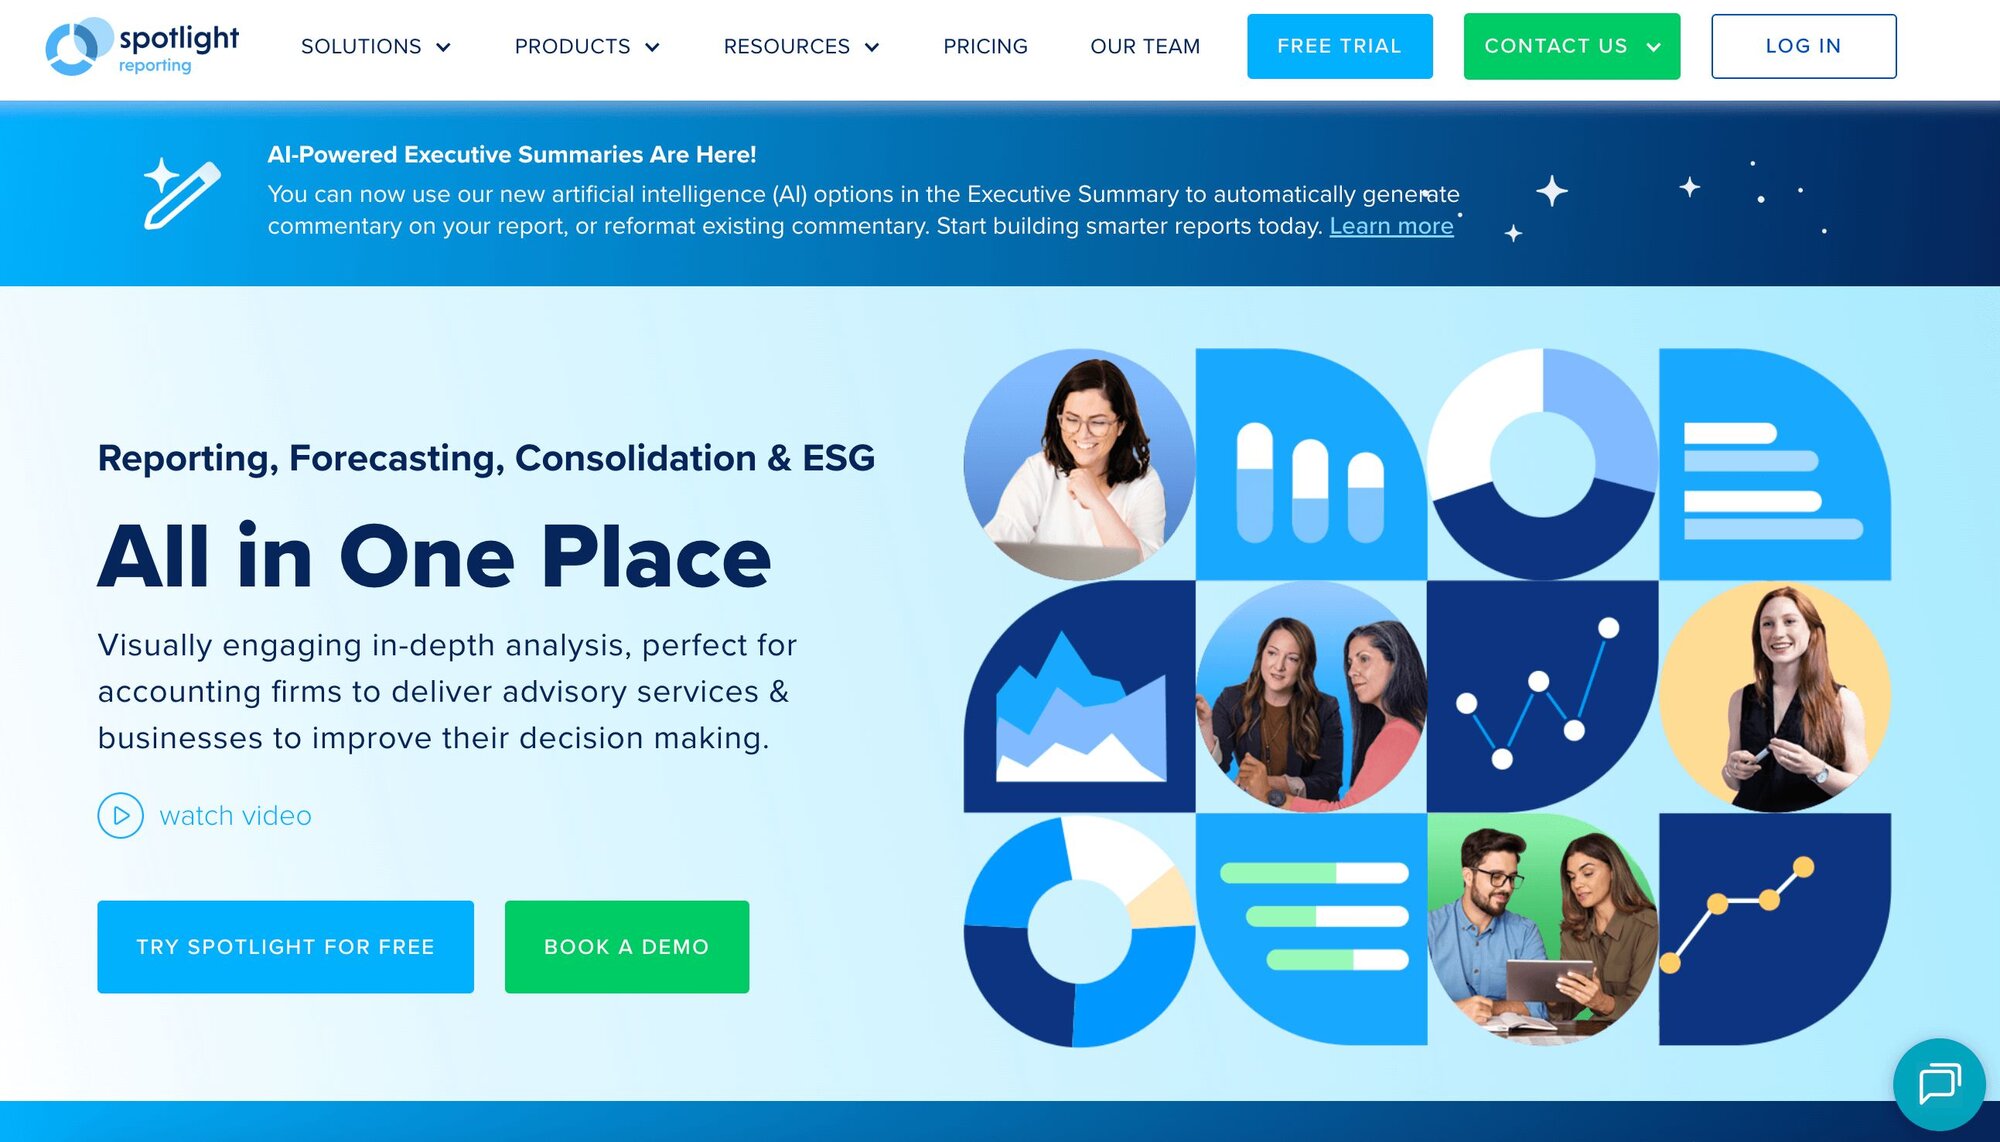
What it does: Spotlight Reporting is a cloud-based platform that focuses on management reports, forecasting, and consolidations. It’s designed to give accountants and finance teams polished outputs without heavy setup.
Who it’s for: Accountants, CFOs, and finance teams that want visual management reports across multiple entities.
I started in Spotlight Reporting by connecting data from Xero and Google Sheets. The import process was pretty straightforward. I pulled in the chart of accounts and then mapped expenses, assets, and liabilities into categories. Having both financial and non-financial data in one place gave me more flexibility than a basic accounting tool, plus I didn’t have to go multiple places to get what I needed.
Once the data was loaded, I tested the report templates. The management report came pre-built with cash flow, P&L, and balance sheet sections, which saved me time compared to designing each layout. I also added KPIs from my spreadsheet, like customer churn and revenue per employee, and Spotlight displayed them alongside the financials.
Consolidation was another feature I tried. I combined two entities with different currencies and used Spotlight’s elimination rules to clean up intercompany transactions. That gave me one consolidated set of accounts without manual adjustments.
The presentation tools stood out during testing. I previewed the report in PDF, customized the charts, and added commentary boxes for context. The end result looked polished enough to share directly with a board or investor group, which cut down the time I’d normally spend formatting slides.
Key features
Reporting templates: Pre-built management and board reports
Consolidation: Handles multiple entities with ease
Forecasting: Includes three-way forecasting (cash flow, P&L, balance sheet)
Integrations: Works with Xero, QuickBooks, and Excel
Visualization: Clean, presentation-ready charts and layouts
Buy if
You want polished reports for clients or boards
You manage multiple entities and need consolidations
You prefer templates over building reports from scratch
Don’t buy if
You want highly customizable dashboards
You need deep scenario modeling beyond forecasting
Pricing
Spotlight Reporting starts at $35 per month for a Business Plan for 1 organization.
Bottom line
Spotlight Reporting saved me time on polished reports and consolidations, but it’s lighter on customization. If you need a broader financial analysis tool with flexible dashboards, Power BI may be the better option.
10. Fathom: Best for KPI tracking and cash flow forecasts
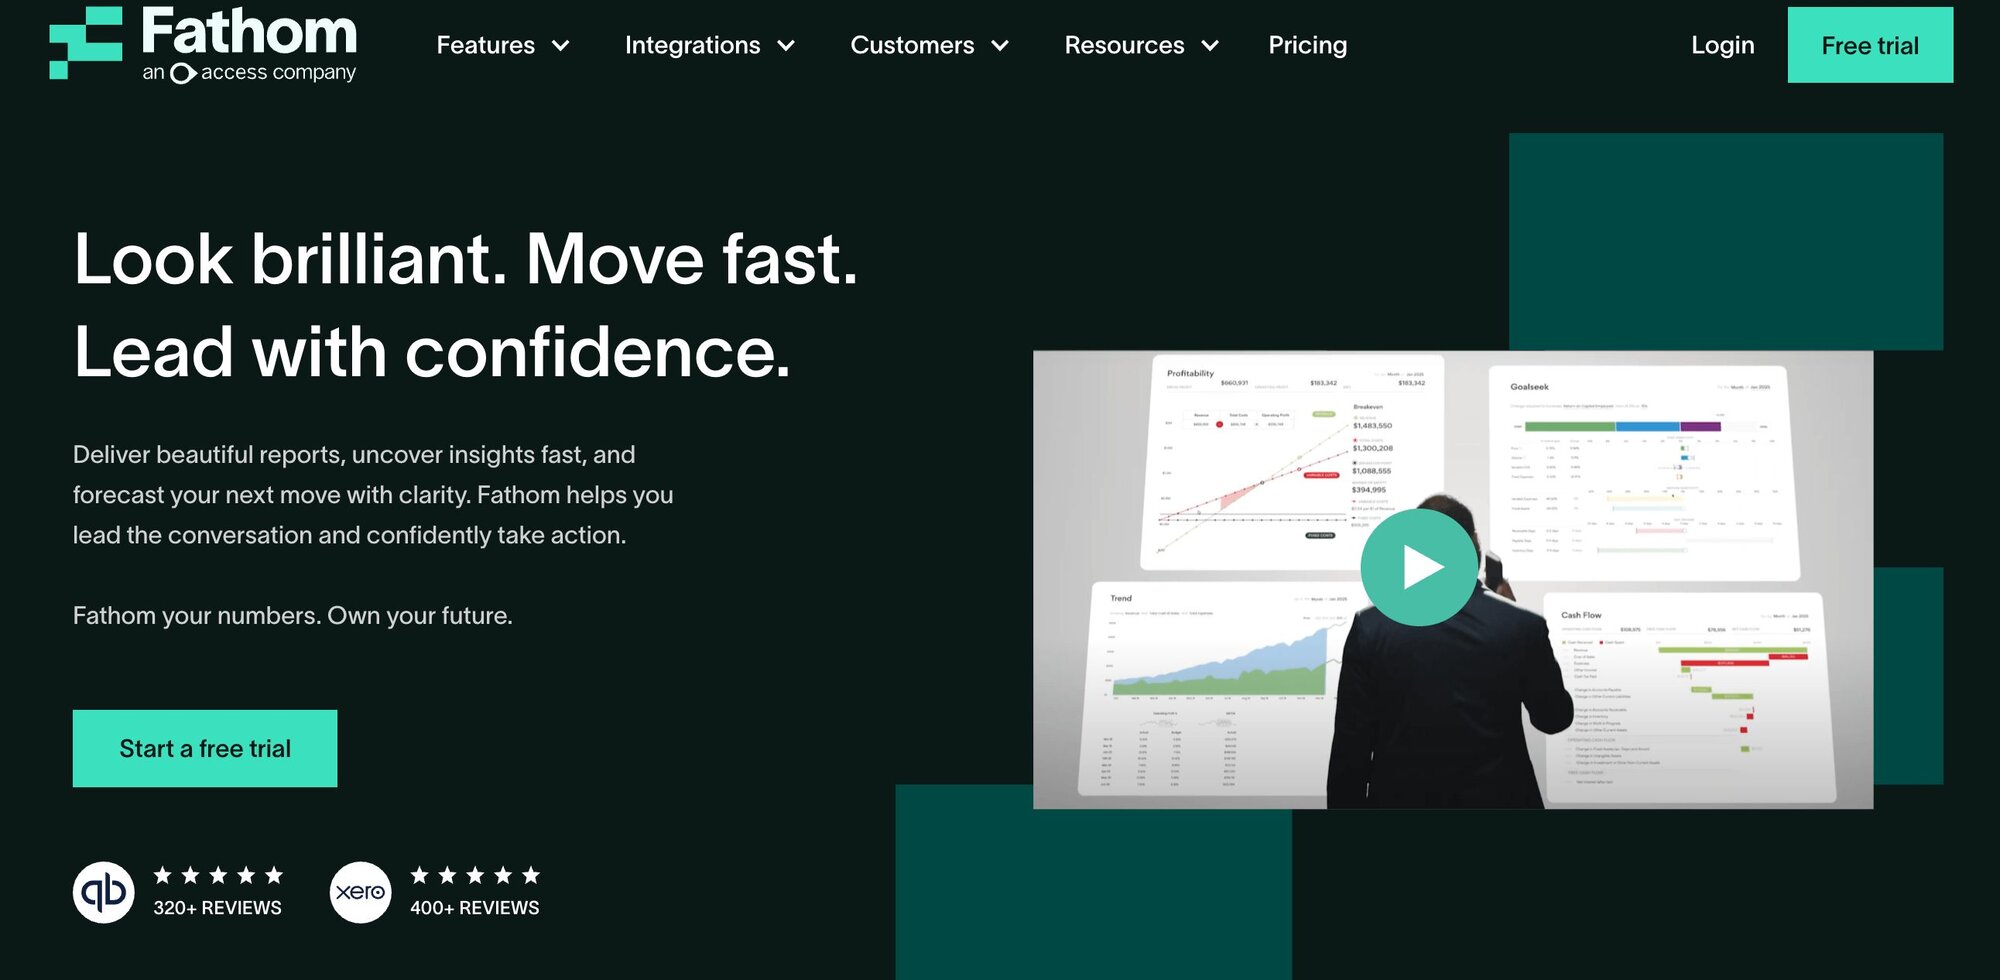
What it does: Fathom is a reporting and forecasting tool that helps businesses track KPIs, monitor cash flow, and create management reports.
Who it’s for: Small to mid-sized businesses that want easy-to-read visuals for financial health and performance.
I tested Fathom by connecting it to QuickBooks and loading several months of financial data. The onboarding moved quickly since the tool pulled account structures straight from the ledger. Once the data synced, I went into the KPI dashboard and selected profitability, liquidity, and activity ratios to track. The visuals updated instantly, which made the numbers easier to explain in a meeting setting.
Cash flow forecasting was where I spent most of my time. Fathom runs three-way forecasts across P&L, balance sheet, and cash flow, and I could add scenarios to see how new hires or capital purchases might affect the numbers. Building those forecasts in Excel would have taken hours, but in Fathom, it only required filling in a few assumptions and letting the system handle the rest.
The reporting templates stood out as well. I generated a monthly performance report, added commentary, and exported it to PDF for distribution. The charts looked clean without extra formatting. I also tried the Portfolio view, which let me compare results across multiple entities in one dashboard.
Key features
KPI tracking: Monitor performance across key financial metrics
Cash flow forecasting: Easy-to-use visual forecasts
Reporting: Customizable management reports
Integrations: Connects with Xero, QuickBooks, and MYOB
Multi-entity support: Consolidates results across businesses
Buy if
You need visual reports for clients or executives
You want a quick setup with minimal training
You manage cash flow and KPIs across entities
Don’t buy if
You need deep scenario modeling or enterprise forecasting
You want customizable dashboards beyond pre-set visuals
Pricing
Fathom starts at $53 per month for one company and an additional $53 per company.
Bottom line
Fathom made KPI reporting and cash flow forecasting easy, but it lacked the modeling power of full financial planning and analysis software like Workday Adaptive Planning.
11. Board: Best for enterprise performance management
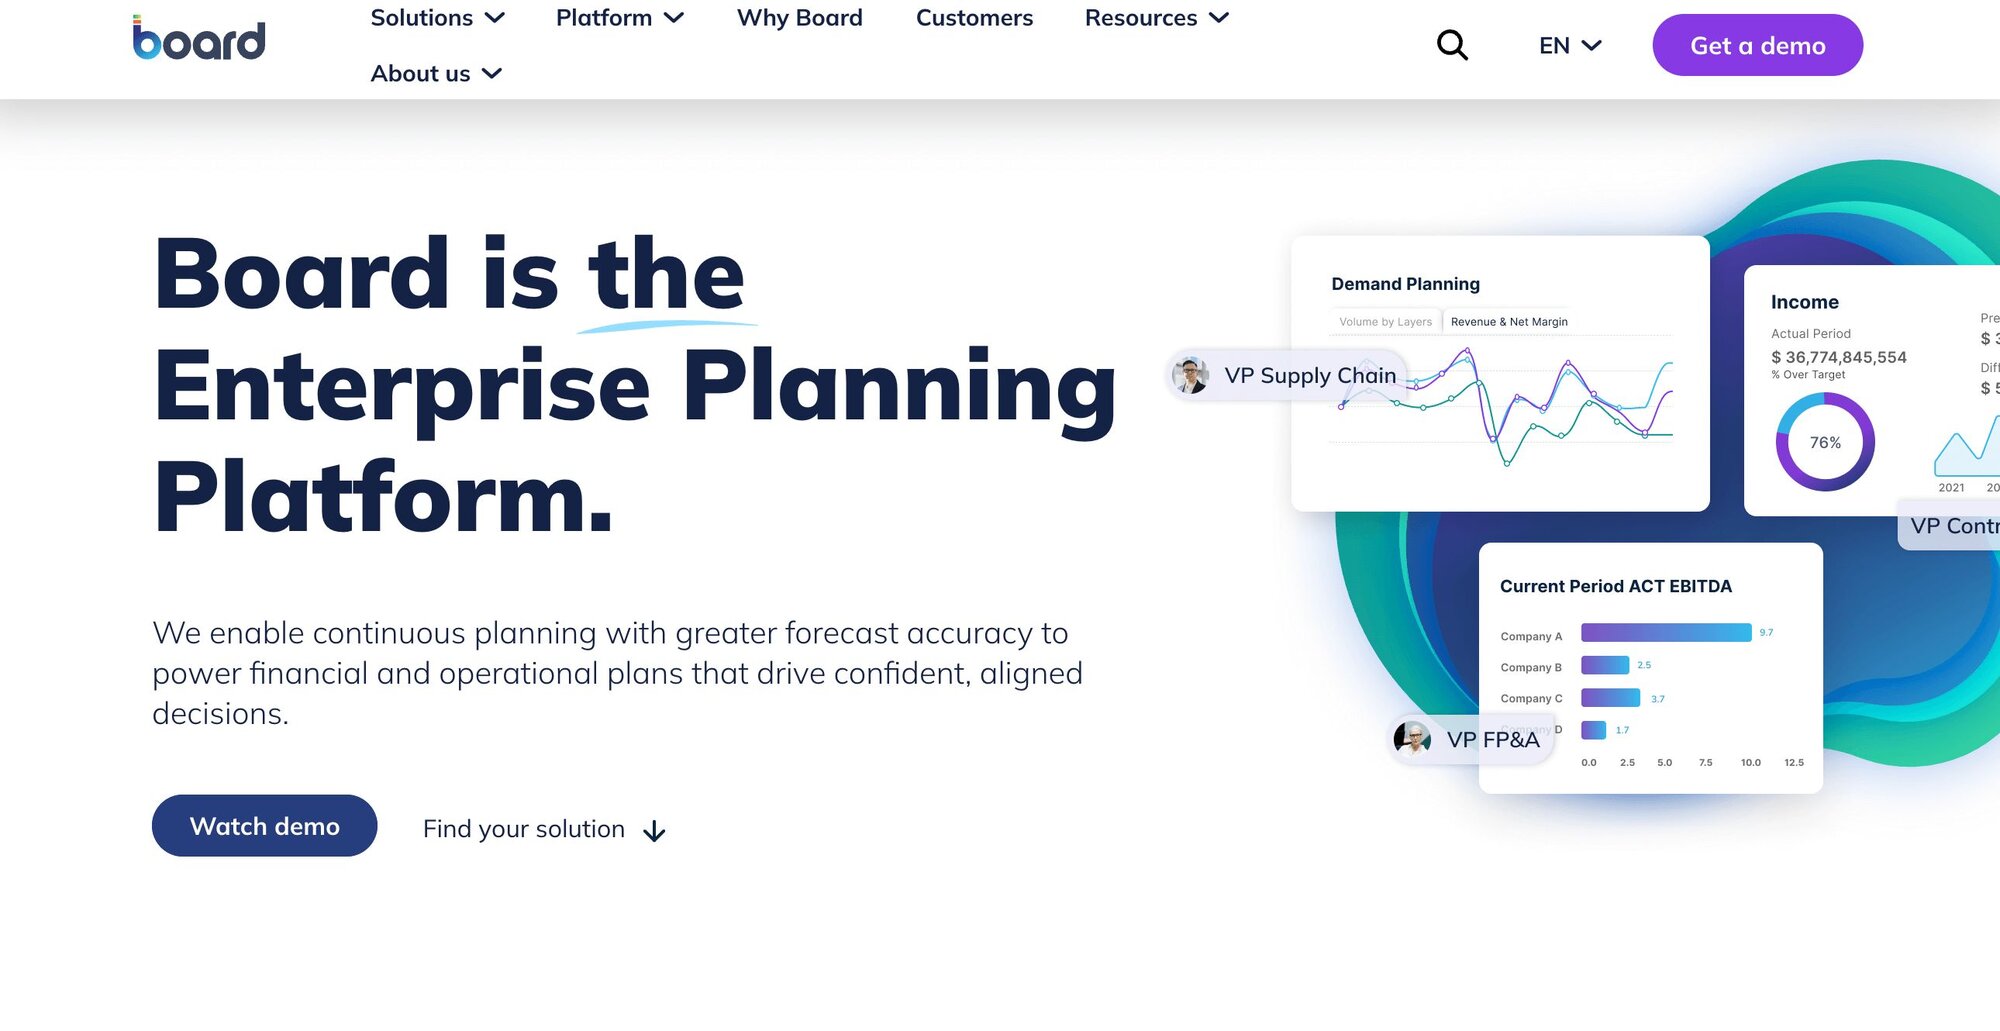
What it does: Board is an enterprise performance management platform that combines financial reporting, business planning, and analytics in one system.
Who it’s for: Enterprises that want integrated planning, forecasting, and reporting across departments.
When I tested Board, I wanted to see how it handled planning and reporting together in one system. I started by importing financial data from a sample ERP and then built a combined dashboard with revenue, expenses, and operational KPIs. Unlike lighter reporting tools, Board let me bring in both financial and non-financial drivers, so I could see how sales activity is linked to profitability in one place.
Scenario modeling was the feature I explored most. I set up different versions of a budget — one with flat revenue growth and another with an aggressive expansion plan — and compared them against actuals. Switching between versions helped me see the trade-offs in hiring and capital investment without reworking the model from scratch.
The reporting side felt more structured than in tools like Fathom or Spotlight. I created a management report that pulled directly from the dashboards and added notes for context. I liked that I could drill down into the numbers during a review call without leaving the report view.
Board took longer to configure, but once it was running, I had one environment for both planning and performance tracking. That integration cut down on the need to juggle separate forecasting and reporting systems.
Key features
Unified platform: Combines reporting, planning, and analytics
Scenario modeling: Run multiple business cases
Dashboards: Customizable financial and operational views
Integrations: Connects with ERP, CRM, and HR systems
Collaboration: Supports cross-department planning
Buy if
You want integrated reporting and planning in one system
You manage performance across multiple departments
You need scalability for enterprise data volumes
Don’t buy if
You’re a smaller company with basic reporting needs
You want a tool that’s fast to set up and easy to use
Pricing
Board offers custom pricing. To learn more, request a quote.
Bottom line
Board worked pretty well for linking reporting and planning, but it required more setup than mid-market tools. If you want financial reporting and analysis software that balances power with ease of use, Sage Intacct may be a better fit.
12. Datarails: Best for Excel-based FP&A
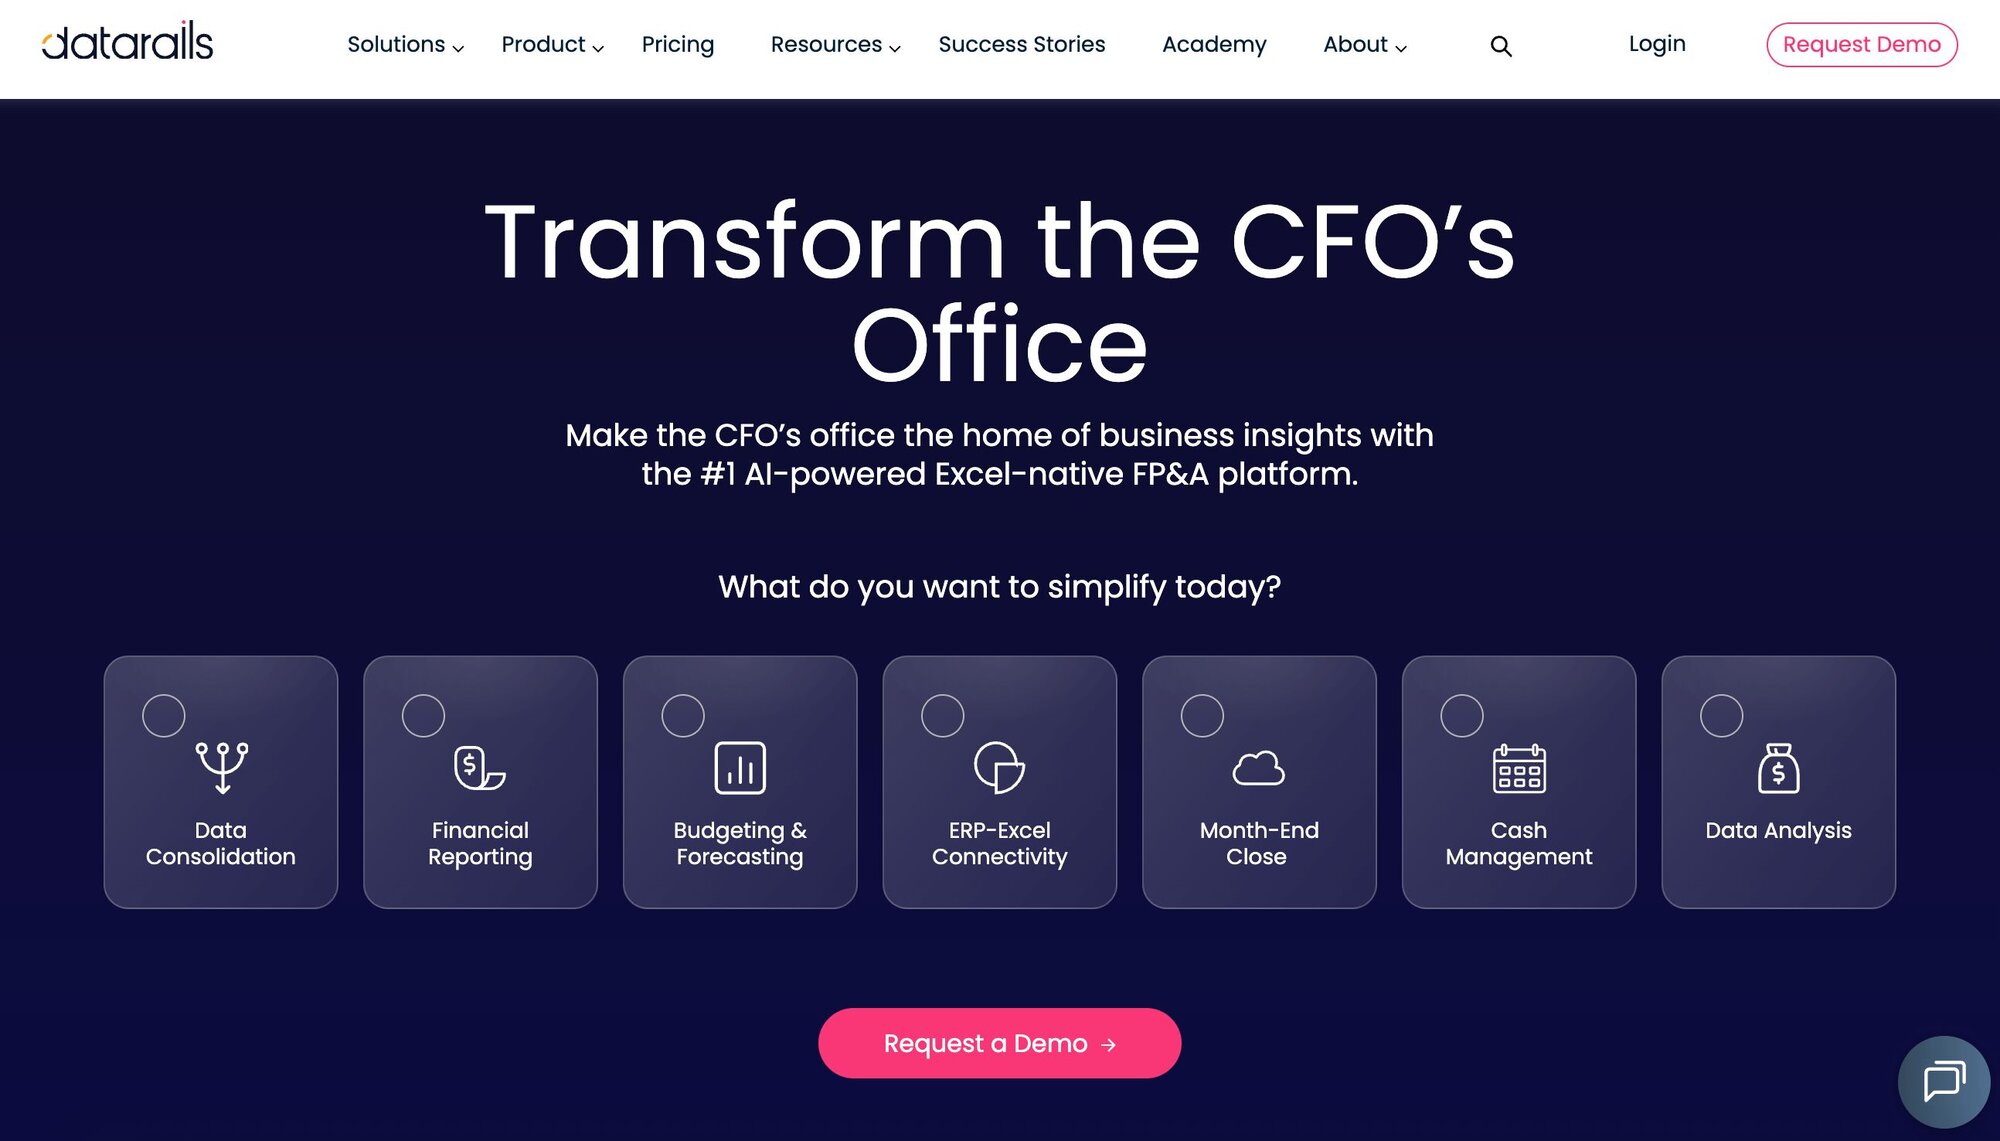
What it does: Datarails is a financial planning and analysis platform that layers automation and reporting on top of Excel. It’s designed for teams that want to keep their spreadsheets but scale them with added structure.
Who it’s for: Finance teams that live in Excel but need stronger reporting and collaboration.
Working with Datarails was like taking Excel to the next level without leaving the spreadsheet environment. I could still build formulas and layouts the way I normally would, but the platform handled consolidations, version control, and reporting behind the scenes. That meant fewer broken links and fewer late nights chasing down numbers across files.
One feature I leaned on was Cash Management. It gave me real-time visibility into balances across accounts and updated forecasts automatically. I didn’t have to wait for manual uploads or reconciliations to know where things stood. The Month-End Close module was another standout. Pulling all reconciliations and approvals into one workspace made closing the books less about tracking emails and more about moving jobs forward.
I also tested Genius, their AI assistant. It answered plain-language questions and built draft reports faster than I expected. While it didn’t replace detailed modeling, it cut down the time I spent on repetitive reporting.
Key features
Excel integration: Works directly with Excel
Consolidation: Automates rollups across departments and entities
Data analysis: Centralizes financial data for cleaner insights
Collaboration: Lets multiple team members work in sync
Audit trail: Tracks changes and version history
Buy if
You want to keep Excel but scale your workflow
You need automation to replace manual consolidations
You prefer working in a familiar spreadsheet interface
Don’t buy if
You want highly visual dashboards or BI features
You need a lightweight tool for small-business accounting
Pricing
Datarails uses custom pricing. Request a quote to learn more.
Bottom line
Datarails gave me control of Excel with added automation for reporting and analysis. If dashboards and visualizations are the priority, Microsoft Power BI may be a stronger choice.
13. Zoho Analytics: Best for SMB reporting and BI
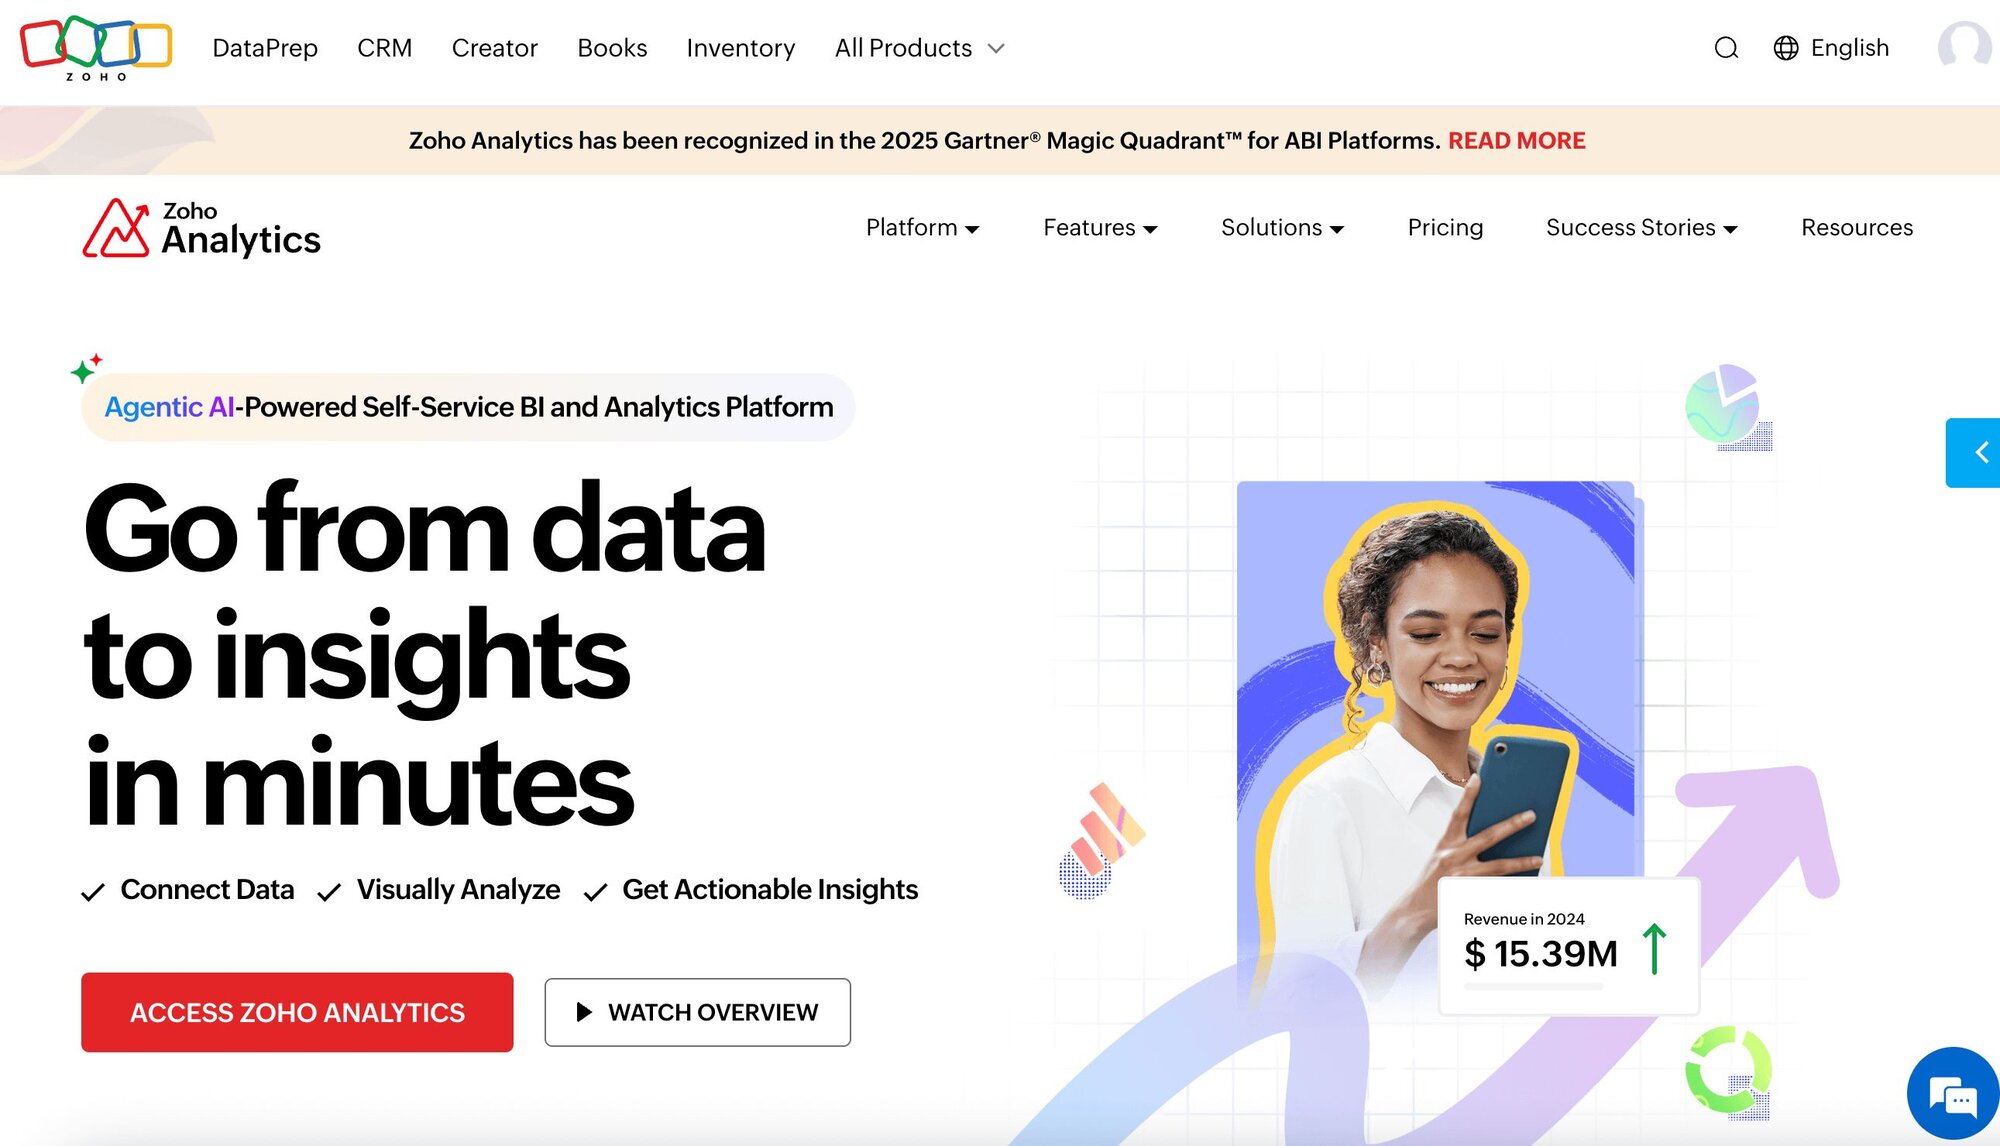
What it does: Zoho Analytics is a cloud-based BI and reporting platform that helps businesses connect data, create dashboards, and automate reporting.
Who it’s for: Small to mid-sized businesses that want an affordable way to build dashboards and share reports.
When I tried Zoho Analytics, I noticed right away how fast I could bring different data sources into one place. I connected Stripe, Google Ads, and a warehouse, and the platform pulled everything into a single dashboard without much setup.
The AI assistant, Zia, added value by explaining trends in plain language. It highlighted that one region’s revenue growth was falling behind the rest, which helped me spot a gap I might have missed just looking at charts.
The data prep tools also saved me time. I cleaned up columns, merged datasets, and created custom fields without needing SQL. From there, I built dashboards with maps, trend lines, and bar charts that made comparisons easy to follow. Having over 50 visualizations to choose from kept things flexible without slowing me down.
Sharing was simple. I pushed reports to teammates through Slack and email so they could dig in on their own, instead of waiting for me to send spreadsheets.
Key features
Data integrations: Connects to 500+ business apps and databases
Dashboards: Drag-and-drop report builder for visual insights
Collaboration: Share dashboards across teams or embed them online
Automation: Schedule recurring reports by email
Mobile app: Access dashboards on the go
Buy if
You want affordable BI and reporting for SMBs
You need an easy setup with limited IT support
You use other Zoho products and want tight integration
Don’t buy if
You need enterprise-grade customization or scalability
You want advanced forecasting or scenario planning
Pricing
Zoho Analytics starts at $60 per month for 5 users with cloud deployment and $30/user/month for a minimum of 5 users for on-premise. There are higher tiers with more data and advanced features.
Bottom line
Zoho Analytics worked well for quick reporting and dashboards, but it lacked the depth of enterprise tools. If you need more powerful business intelligence and reporting software, Microsoft Power BI may be a better option.
How I tested and compared these financial analysis software tools
I tested each tool by putting it through common finance jobs like forecasting, reporting, and consolidations. For cloud platforms, I connected sample company data and watched how well the dashboards pulled everything together. For spreadsheet-based tools, I paid attention to whether they actually cut down on the copy-paste work that can eat up hours.
I also weighed how easy each one was to set up, how fast I could get value from it, and whether the pricing matched what it delivered. Some tools were quick to get going, but felt thin once I pushed further. Others had plenty of depth but needed more time and patience to learn.
In the end, I judged each platform on a simple question: Did it save me time and give me insights I could trust?
How to choose the right financial analysis software
It’s a good idea to figure out what you need before choosing your financial analysis software. Here’s how I’d break it down:
For small businesses: QuickBooks or Zoho Analytics keep reporting simple and affordable.
For spreadsheet-heavy teams: Cube and Datarails add automation and consolidation without forcing you off Excel or Google Sheets.
For larger enterprises: NetSuite and Workday Adaptive Planning handle multi-entity reporting, structured forecasting, and deeper planning needs.
For cash flow visibility: Fathom and Spotlight Reporting generate polished reports and clear forecasts.
For flexible dashboards: Microsoft Power BI gives the most options for building visual reports across finance and operations.
For ad-hoc analysis: Julius delivers fast answers when you want insights without waiting on reports or analysts.
My verdict
No single tool covered everything I needed. Cube fit best when I wanted to stay in spreadsheets, while NetSuite had the structure for enterprise consolidations. Fathom and Spotlight Reporting made it easy to share polished reports, and Power BI gave me more room to build custom dashboards.
The one I leaned on most was Julius because it gave me quick answers. It’s not a full replacement for structured planning, but paired with Workday Adaptive Planning or Sage Intacct, it struck a good balance between speed and depth.
For small businesses, I’d still point to QuickBooks or Zoho Analytics as the easiest starting point.
The future of financial analysis with AI
AI is changing the finance world, and you can already see the impact in the numbers. By late 2024, 62% of US companies were using AI in finance, and more than half expected to beat their ROI targets because of it.
Bloomberg even reports that analysts could automate up to 80% of their workload, giving them more time to focus on strategy.
In real terms, that means faster answers with plain-language queries, fewer errors thanks to automation, easier access for non-technical users, and smarter planning with forecasts and risk alerts.
AI and AI tools won’t replace traditional financial analysis software. Instead, it will make the programs more powerful, giving teams speed and flexibility where it counts, and smoothing into workflows naturally.
How Julius can help with financial analysis
Most finance teams picture rows of spreadsheets when they think about reporting and forecasting. It works, but it’s heavy. A single chart often tells the story better than a thousand cells ever could, and that’s where Julius shines.
If speed is what you need, we designed Julius to be a pocket data scientist that gives you answers on the spot without waiting for reports.
Here’s how it can help:
Cash flow analysis: Ask a plain-language question like “What were our inflows and outflows last quarter?” and get a chart in seconds.
Net revenue retention (NRR): Upload subscription data or connect your database to see expansions, downgrades, and churn broken down automatically.
Database connectors: Pull financial metrics straight from Postgres, Snowflake, or BigQuery without writing SQL.
Ad-hoc reporting: Skip templates and run quick checks for board meetings, investor updates, or internal reviews.
Scheduled insights: Send recurring reports to Slack or email so you don’t need to rerun the same analysis each week.
Ready to see how Julius can speed up your financial analysis? Try Julius for free today.
