September 11th, 2025
What Is Cluster Analysis? Methods & Examples (2025)
By Connor Martin · 12 min read

Cluster analysis helps me find patterns in data by grouping similar points together. I’ve used it to segment customers, spot anomalies, and compare performance across regions.
In this guide, I’ll explain what cluster analysis is and why it matters. I’ll also highlight how marketers can put it to use and how the same approach also helps in other areas like finance, product, and operations.
What is cluster analysis?
Cluster analysis is a statistical method that groups data points with similar characteristics into distinct clusters. It’s an unsupervised learning method, which means the algorithm finds patterns without needing predefined labels. The goal is to reveal natural groupings and structures that aren’t immediately apparent.
Here’s a simple visual I made with Julius to show how it works. Each point represents a customer, and the algorithm groups them into clusters based on buying patterns:

Why use cluster analysis?
Cluster analysis is useful because it automatically groups similar data points, revealing patterns and insights that are hard to spot manually. I often turn to it when I want the data to show its own structure, since it helps me avoid oversimplifying and missing hidden differences.
In marketing, I’ve used it to break large audiences into smaller segments that respond differently to campaigns.
But in other areas, such as in finance, teams apply it to spending data to spot clusters of unusual transactions. Product managers look at usage data to see which features bring groups of customers together, and operations teams use it to compare performance across sites or regions and spot patterns that aren’t obvious in raw totals.
What I like most is that clustering doesn’t require a guess about where the boundaries are. It shows you the groups first, and then you decide what those groups mean.
Main methods of cluster analysis explained
There are many clustering techniques, but a few show up often in practice. Each one takes a different approach to grouping data, which is why I usually test more than one before deciding which result makes sense.
Here’s a quick visual of the main methods side-by-side, generated by Julius in seconds:

Now let’s discuss the main types, with some cluster analysis examples:
K-means clustering
K-means is one of the most widely used clustering methods.
You choose the number of clusters, and the algorithm assigns each point to the closest center. It works well on large datasets with clear groupings, but struggles if the clusters have irregular shapes.
A closely related method, k-medoids, uses medoids (actual data points that serve as cluster centers) instead of means. This makes it more resistant to outliers, but it often runs slower, especially on large datasets.
I’ve used k-means to segment large customer datasets into groups like frequent buyers, occasional buyers, and inactive accounts. It gave the marketing team a simple way to target each segment differently.
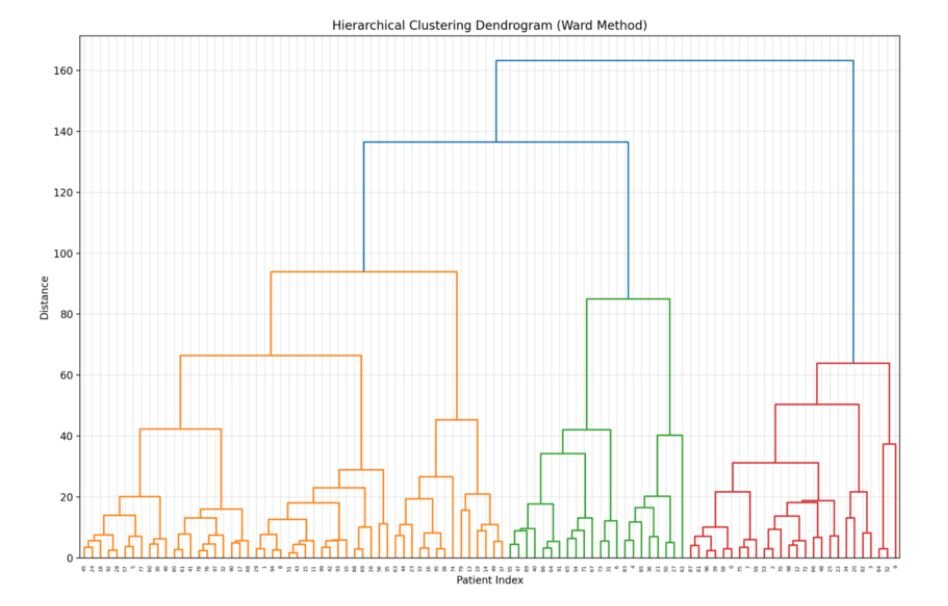
Hierarchical clustering
Hierarchical clustering builds a tree of clusters. You don’t need to set the number of groups upfront, and you can cut the tree at different levels to see more or fewer clusters. It’s easier to explain but slower on big datasets.
I once applied it to survey responses, and the tree structure made it easy to see how smaller subgroups rolled up into broader categories. It gave us a clear view of how opinions clustered together at different levels.
DBSCAN (Density-Based Spatial Clustering of Applications with Noise)
DBSCAN identifies clusters as regions where data points are densely packed together, and it classifies points in low-density areas as noise or outliers, instead of assigning every point to a cluster. It’s helpful when the data has noise or clusters of very different sizes.
I’ve seen this work well with website analytics. DBSCAN separated normal user activity from odd spikes of bot traffic, which made the data far more reliable for decision-making.
Gaussian Mixture Models (GMM)
Gaussian Mixture Models (GMM) take a probabilistic approach, allowing each data point to belong to multiple clusters with different probabilities. This is useful when clusters overlap, unlike k-means, which assigns each point to only one group.
I tested GMM on marketing engagement data. Some users fell into overlapping clusters, like being highly engaged on email while only moderately active on social. GMM handled that overlap better than k-means, which forced everyone into just one category.
How to choose the right method
One challenge I’ve run into with cluster analysis is knowing which method to try first. Each one works best with certain types of data and goals, so picking the right fit saves time and avoids confusion.
In practice, though, I rarely rely on just one method. I’ll usually test a couple and compare results to see which clusters make the most sense. Sometimes the patterns line up across methods, which gives me more confidence in the outcome. Other times, one method highlights a structure that the others miss.
Here’s a simple guide I use to decide which cluster analysis method to start with:

How to know if your clusters are reliable
Clustering results can look clear at first, but that doesn’t guarantee the groups are meaningful. You might see neat clusters on a chart that fall apart once tested on new data.
Here are a few ways you can check reliability:
Internal metrics: Use measures like the silhouette score to see if points sit closer to their own cluster than to others.
Stability checks: Rerun the analysis with a different sample to see if the same clusters appear again.
Domain sense check: Compare the groups against what you already know about the business. If they don’t line up with real behavior, treat it as a red flag.
Replication on new data: Apply the clusters to a fresh dataset and check whether they still hold.
The domain check is often the most valuable. Numbers can suggest the clusters are strong, but if they don’t reflect what’s happening in the business, they aren’t useful.
How to handle missing data in cluster analysis
Most datasets have gaps, and clustering can break down quickly if you don’t address them. Some methods won’t even run with blanks, while others give results that look stable but are misleading.
In marketing, you might see gaps in demographics like age or location. In operations, it could be missing delivery times. Whatever the source, those gaps weaken the reliability of clusters unless you handle them.
Here are a few approaches you can use:
Remove rows with too much missing data: Works when gaps are rare, but you risk throwing out valuable information if the problem is widespread.
Impute missing values: Fill in blanks with averages, medians, or more advanced methods like regression. This keeps the dataset intact but can introduce bias if you’re not careful.
Use algorithms that tolerate missing data: Some clustering methods, or variants of them, can work with incomplete inputs, though options are limited.
Focus on partial data clustering: In some cases, you can cluster on the features that are complete and ignore the rest, which gives a rougher but still useful picture.
The right choice depends on how much data is missing and what the clusters will be used for. If it’s a marketing dataset with only a few missing demographics, imputation is usually fine. But if large chunks are missing, you might want to step back and reconsider whether clustering is the right approach.
How Julius can help with cluster analysis and more
Cluster analysis helps uncover groups in your data, but setting it up manually can take a lot of time. With Julius, you can run clustering in plain language without writing code or juggling multiple tools.
We designed Julius to make analysis faster and easier, so you can focus on the insights instead of the setup.
Here’s how Julius helps with cluster analysis and beyond:
Quick clustering: Ask something like “Run k-means on customer purchase data with 3 clusters” and get the results before you finish your sip of coffee.
Built-in visuals: Generate scatterplots, dendrograms, or other cluster charts in your brand style, ready to share.
Method flexibility: Switch between k-means, hierarchical, or DBSCAN just by adjusting your prompt.
Reliability checks: Get metrics such as silhouette score alongside your clusters so you know how strong they are.
Scheduled reports: Set up recurring analyses in Notebooks and have results delivered by email or Slack.
Easy sharing: Export outputs as PNG, PDF, or CSV, or share directly inside Julius.
Ready to see how Julius can get you insights faster? Try Julius for free today.
Frequently asked questions
What is the purpose of cluster analysis?
The purpose of cluster analysis is to group similar data points to reveal hidden structures in datasets. Analysts use it to find patterns in large collections of information, such as identifying customer segments or detecting unusual transactions. In practice, cluster analysis in data mining helps surface relationships that would be hard to spot manually.
How does cluster analysis fit into broader analysis work?
Cluster analysis bridges statistical and data analysis by using statistics to discover groups in raw data. Teams can then use those groups to generate business insights across areas like marketing, finance, and operations.
How is cluster analysis different from dimensionality reduction?
Cluster analysis is different from dimensionality reduction because it creates groups of similar data points, while dimensionality reduction reduces the number of variables in a dataset. Many analysts use dimensionality reduction methods, like PCA, before clustering to make groups easier to interpret.
